
Data
Hotel KPIs every general manager should track weekly
Jul 14, 2026 · 6 min read

Most general managers see more numbers in a week than they can act on. Channel dashboards, bank statements, review sites and the booking calendar each shout their own figures. The skill is not collecting more; it is choosing the few hotel KPIs that describe the health of the business and looking at each one at the right rhythm.
Below are ten indicators that work for hotels, vacation rentals and hostels alike, grouped by what they tell you, with a note on how often to check each. At the end there is a one-page weekly dashboard you can copy.
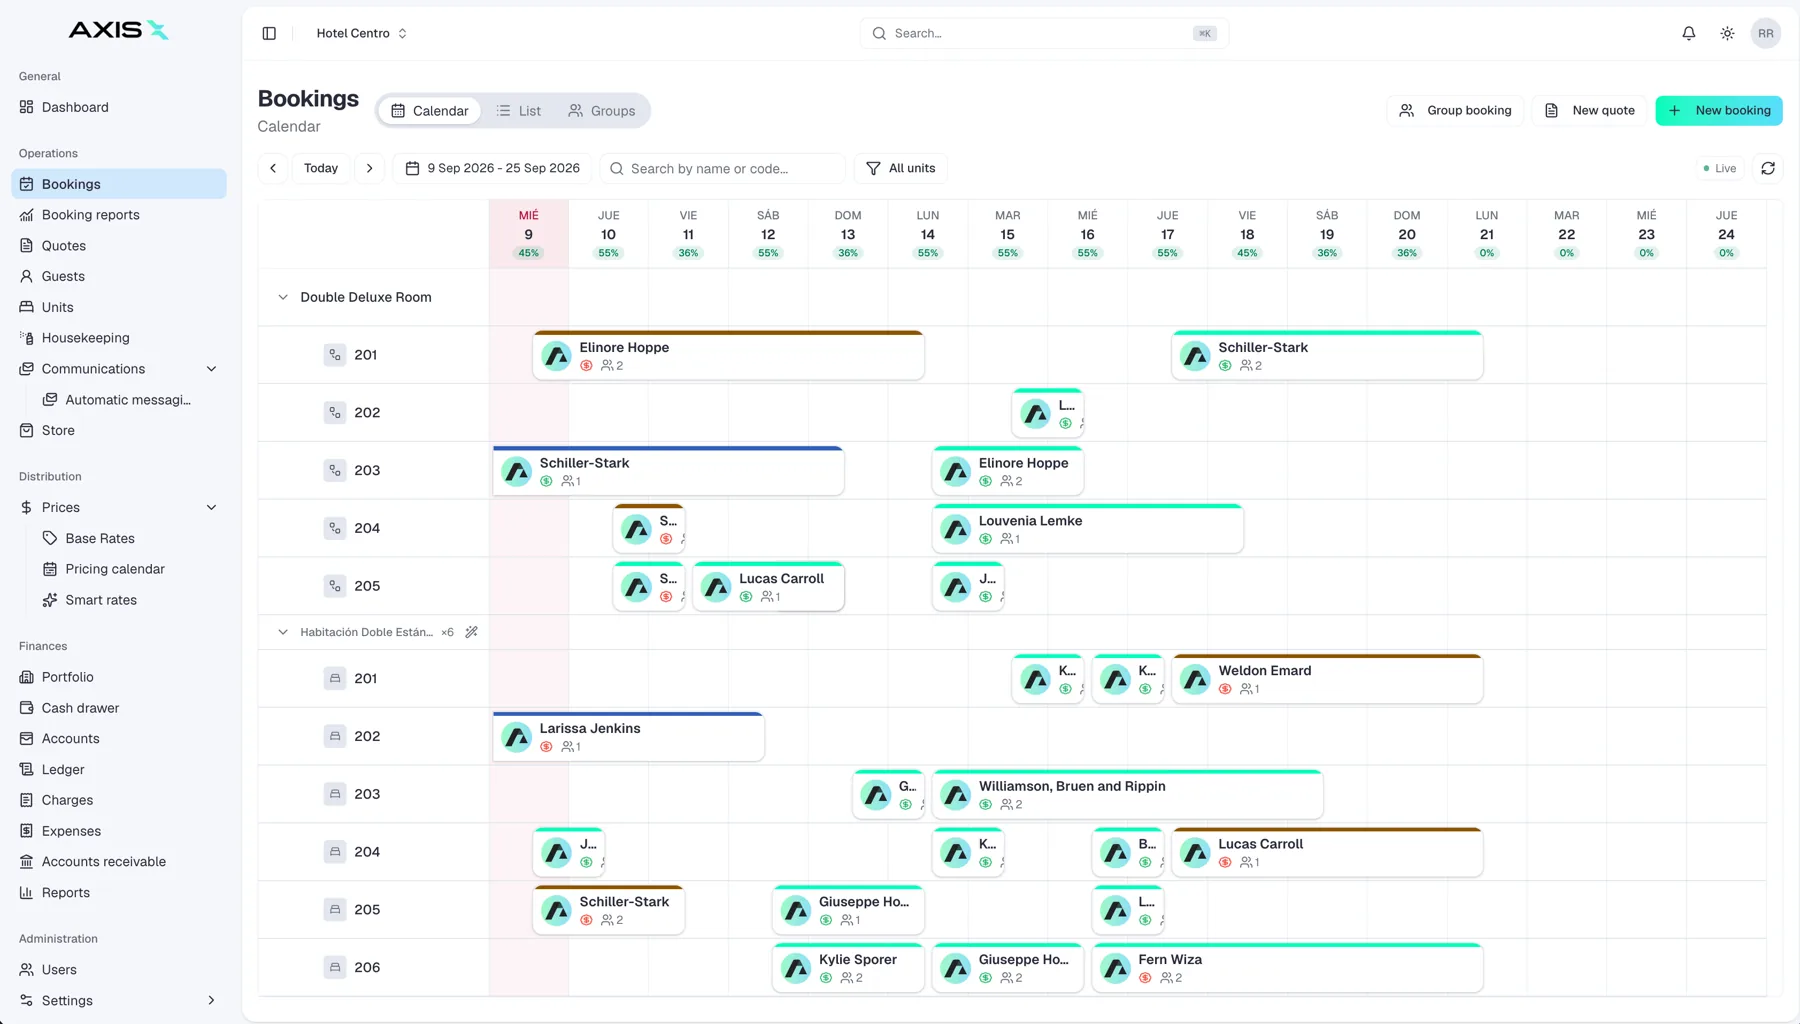
Hotel KPIs for demand and rate
These three are the classic trio, and they are still the fastest read on how the property is doing.
Occupancy
Occupied units divided by available units for the period. It tells you whether people are coming. On its own it is misleading, because you can fill a property by giving it away. Check daily for the next fourteen days, weekly for the next three months.
ADR, average daily rate
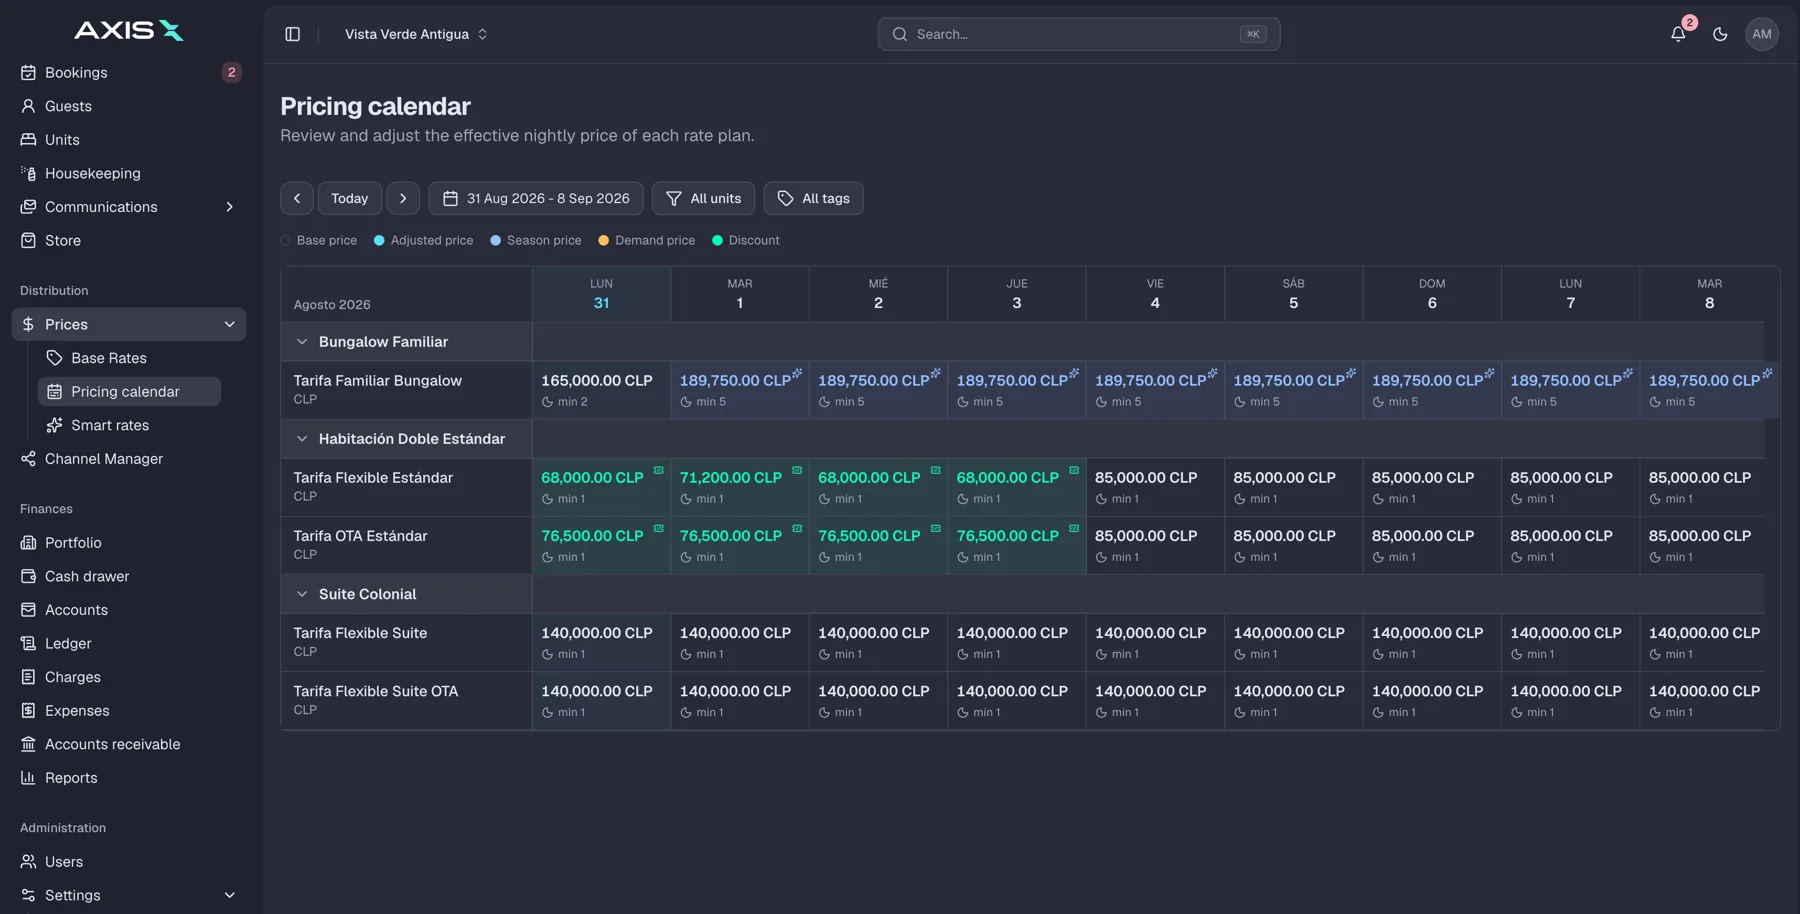
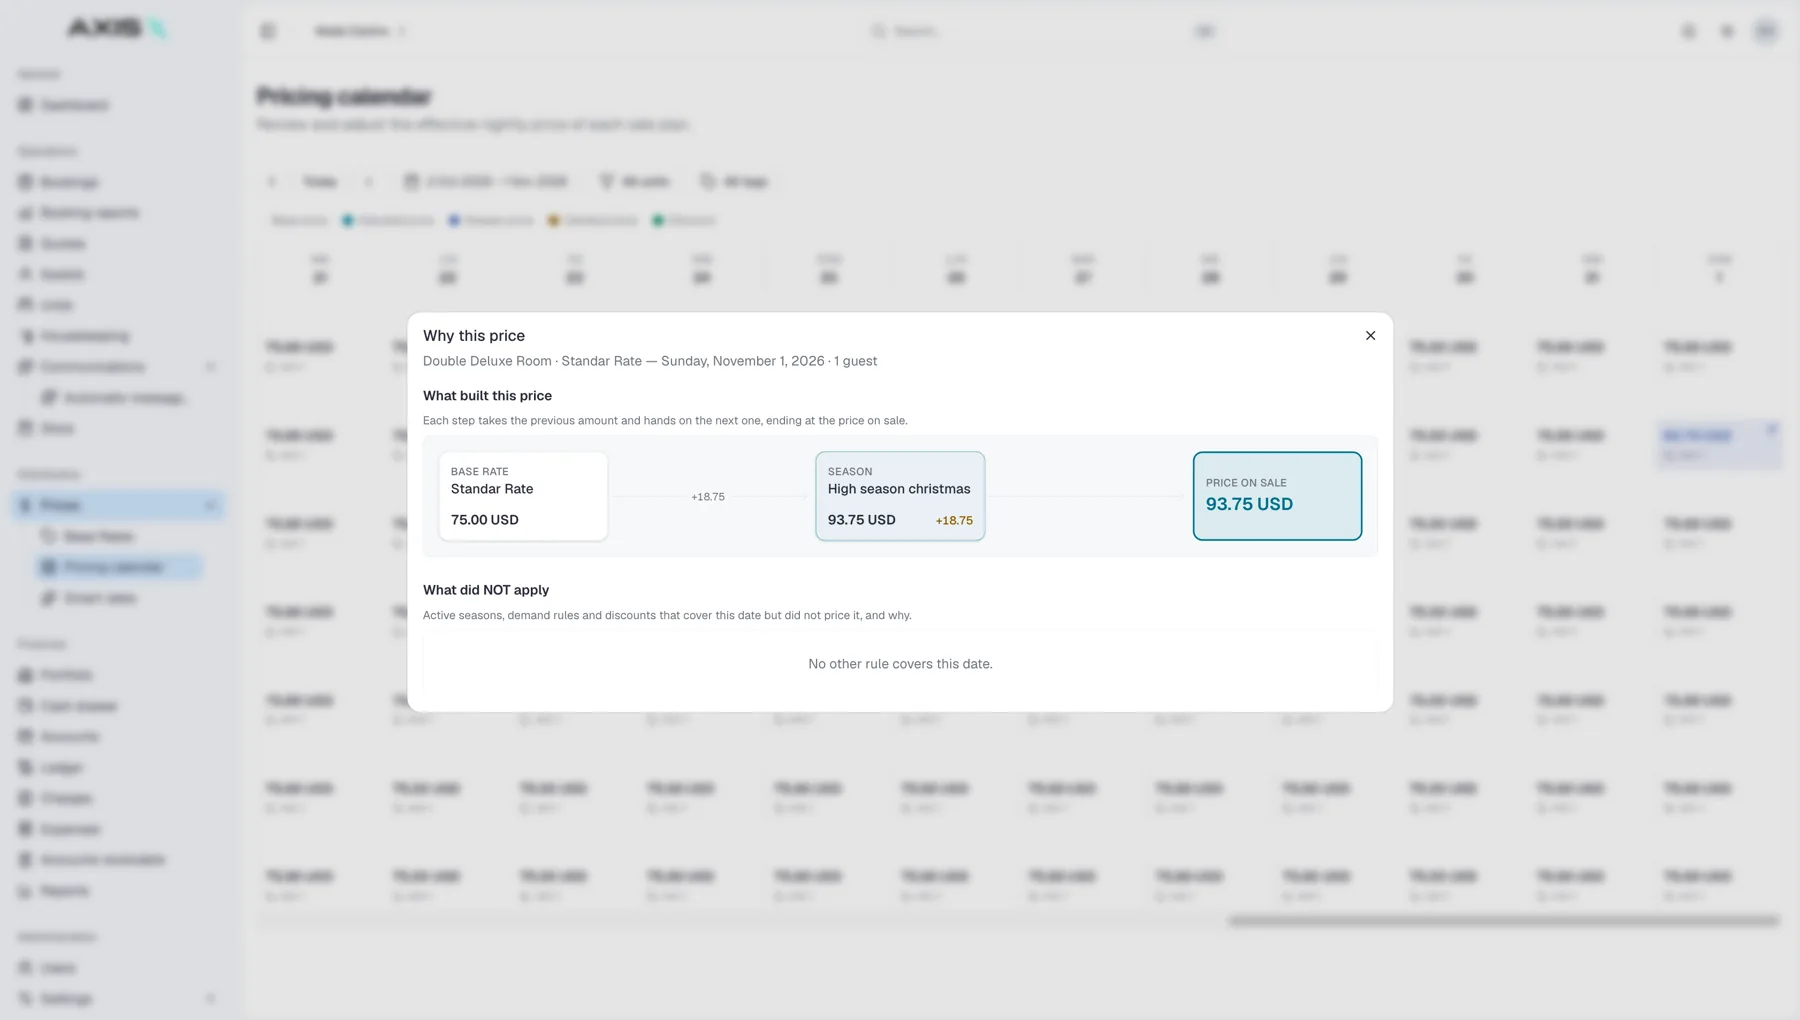
Room revenue divided by rooms sold. It tells you what guests are paying on average. Rising ADR with falling occupancy can be healthy or a warning, depending on the season, so always read it next to occupancy. Check weekly.
RevPAR, revenue per available room
Room revenue divided by rooms available, or simply occupancy multiplied by ADR. This is the single number that combines both halves and lets you compare weeks, months and years. Check weekly, and compare against the same week last year rather than last week.
Hotel KPIs for total revenue and distribution
Rooms are rarely the whole story, and where bookings come from shapes your margin.
TRevPAR, total revenue per available room
All revenue, including breakfast, parking, late checkout, tours, meeting rooms and any bookable space, divided by rooms available. If you sell more than beds, this is the number that shows whether the extras are working. Check monthly.
Direct booking share
Bookings made through your own website, phone or walk-in as a share of all bookings. Direct bookings typically carry lower fees and give you the guest relationship. Track the trend monthly; a slow decline usually means your own channel has become harder to find or to use than the big platforms.
Cost per acquisition by channel
For each channel, commissions and fees paid divided by bookings received, or better, divided by revenue received. This turns "that platform sends us a lot of guests" into "that platform costs us this much per stay". Compute monthly and reconsider your channel mix once a quarter.
Cancellation rate
Cancelled bookings as a share of all bookings, ideally per channel. A high rate on one channel often means flexible policies that attract guests who book several places and decide later. Check monthly, and watch it closely when you change a policy.
Hotel KPIs for guests, staff and money
These are the ones that get skipped when the week is busy, and they are the ones that catch problems early.
Review score
Your average rating across the main sites, together with the volume of new reviews. Read the score weekly and the actual text at least monthly, because the score tells you that something changed and the text tells you what. A small drop with a cluster of comments about noise is more actionable than any number alone.
Staff cost per occupied room
Total wages for the period divided by rooms sold. This is the honest measure of how efficiently you deliver a stay. It rises naturally in low season, so compare it against the same period last year. Check monthly, and use it when planning rosters for the coming season.
Payout accuracy
The share of expected payouts from channels and card processors that arrived on time and matched the booking amount after fees. Many properties never compute this, and it is where small, silent losses accumulate: a missing virtual card payment, a fee that changed, a refund applied twice. Reconcile weekly and record the mismatches.
How often to look, in one view
Daily: occupancy for the next two weeks and any bookings that failed to pay.
Weekly: occupancy, ADR and RevPAR against last year, review score and new reviews, payout reconciliation.
Monthly: TRevPAR, direct share, cancellation rate by channel, cost per acquisition, staff cost per occupied room, review themes.
Quarterly: channel mix, rate strategy, staffing plan for the next season.
The rhythm matters as much as the list. A number checked every day that only moves monthly becomes noise; a number checked quarterly that moves daily becomes a surprise.
The one-page weekly dashboard
Keep it to one screen or one sheet of paper, and keep the layout identical every week so your eye learns where to look.
- Top row: occupancy, ADR and RevPAR for last week, each shown next to the same week last year.
- Second row: the next four weeks of occupancy on the books, with last year's final figure for comparison.
- Third row: review score, number of new reviews, and one line summarizing any recurring theme.
- Fourth row: payouts expected, payouts received, and the list of mismatches with a name responsible for each.
- Bottom: two or three notes. What surprised you, what you changed, what you will check next week.
If your central system holds bookings, payments and reviews together, most of this page can be generated rather than assembled. If it does not, the page is still worth thirty minutes on a Monday morning, because the alternative is finding out in October what went wrong in July.
Frequently asked questions
Which KPI matters most for a small property?
RevPAR compared with last year, because it combines demand and rate in one honest figure. Once that is stable, add payout accuracy, since money that never arrives is the loss most small teams overlook.
How do these KPIs change for vacation rentals or hostels?
The formulas hold; the unit changes. Rentals count apartments or houses, hostels typically count beds rather than rooms, and both should treat cleaning fees and extras as part of TRevPAR. Cancellation rate by channel tends to matter more for rentals because lead times are longer.
Should I share the dashboard with the team?
Yes, at least the first three rows. People who see occupancy and reviews weekly understand why a rate changed or why a checklist was added. Keep wage figures for the management circle, but share the rest.



 Direct
 Booking.com
 Airbnb
 Expedia